A Key Performance Indicator (“KPI”) is a metric used to assess the performance of a business and / or specific parts of it. Typical KPIs can vary depending on industry, business, type of activity within the business and so on.
What is so special about them?
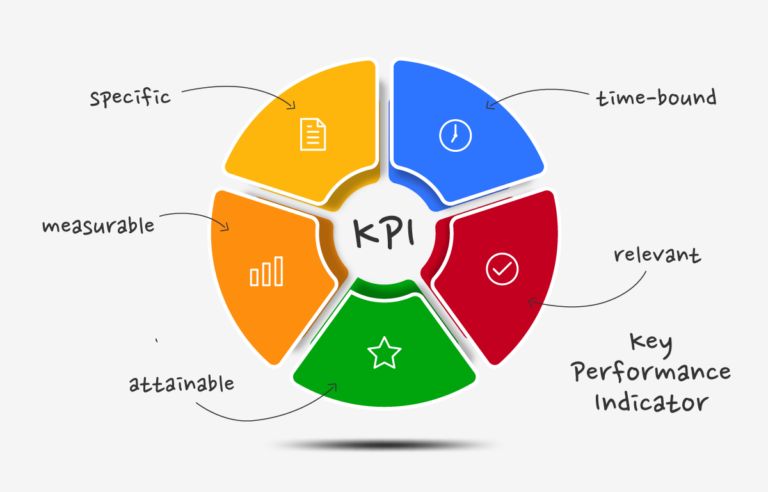
To be considered operationally useful, a KPI should have certain features (Graphic 1). The main reason why KPIs are so widely used in business, though, is that they are quantifiable and measurable – basically, they are numbers. And dealing with numbers (as opposed to opinions) presents many advantages: they are objective, generally unbiased and directly comparable to benchmarks.
Great management tool
Therefore, KPIs represent a formidable management tool: results are conveyed in a clear and concise manner and can be further dissected and translated into actions relatively quickly.
A KPI-BASED CONTROL SYSTEM
Graphic 2
The figures extracted from the income statement are the main input to build a set of KPIs. It is possible to build a system whereby each “operational area” represented in the P&L (sales, expenses, variable cost etc.) is linked to a KPI and therefore can be measured and assessed.
What to compare and how?
Each of the KPIs can then be compared to itself on a historical basis (month/month, year/year, season/season etc.), to targets set by the management and also to industry-accepted standard values.
Example
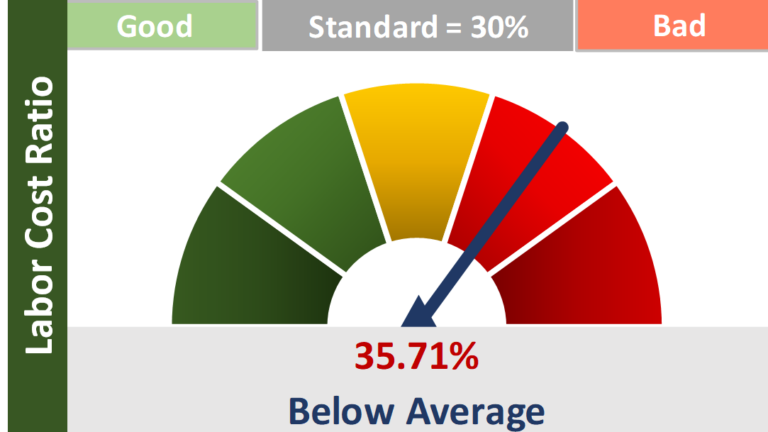
For example (Graphic 2): you are a restaurant manager and you have spent USD 10,000 in payroll this month. Shouldn’t you also know that your Labor Cost Ratio is running at 35.71% versus an industry standard of 30%? Are you running at this level as a strategy or you are just unknowingly overpaying?
LASER-POINT FOCUS VS SHOOTING IN THE DARK
Graphic 3
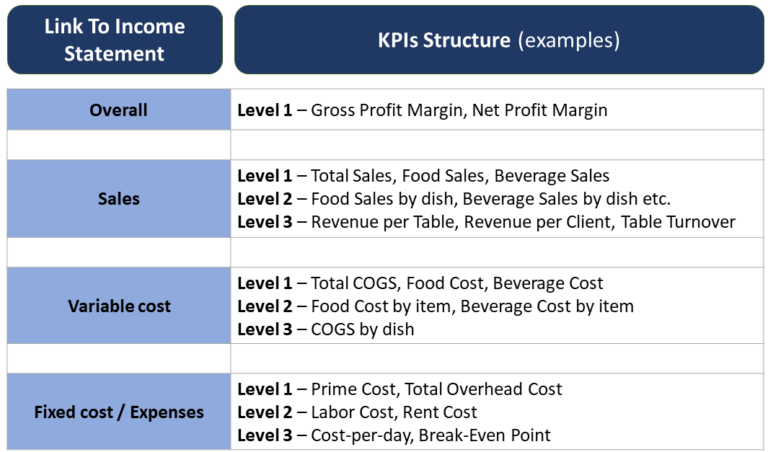
A KPI-based system can be organized into a hierarchical structure according to the desired level of depth.
The first level should always feature indicators of general performance, like the gross profit and the net profit, normally expressed as a ratio to sales.
The table (Graphic 3)illustrates an example of how to structure a restaurant’s KPI system starting from P&L items and other basic inputs (like numbers of clients, number of seats etc.).
The "drill-down" approach
The most important point here is that the hierarchical structure allows to proceed with a cascade (or “drill-down”) approach.
Once an issue is identified through a higher-level KPI, one can move to the next level down to investigate the root causes and figure out a targeted intervention, instead of guessing and second-guessing.
Again: it is not a matter of opinions and points of view, it’s numbers.
A WORKING EXAMPLE: BREAKING DOWN THE PRIME COST RATIO
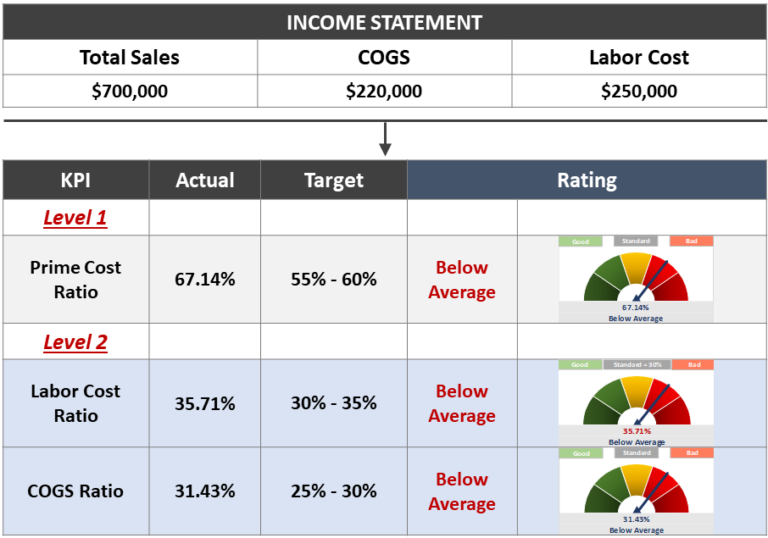
Graphic 4
Graphic 5
The Prime Cost Ratio (“PCR”) is calculated by adding the total cost of ingredients (COGS) and the cost of labor and dividing the result by the total sales amount. Depending on the type of restaurant, a healthy PCR should average between 55% and 60% through the year.
Every restaurant operator should be “obsessed” with it: being a large part of the total cost base and the only “variable” costcomponent, monitoring the PCR should help with an active management approach.
The "drill-down" approach in action
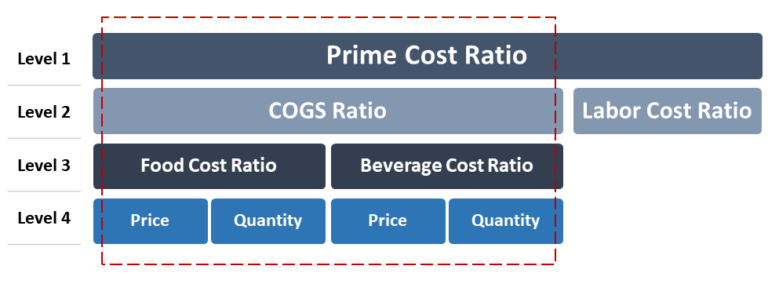
The graphics (Graphic 4 and 5) illustrates how to investigate the PCR in its components, focusing on the COGS Ratio side, for example.
From the income statement, the PCR calculation (Level 1) shows an unimpressive 67.14%, well above the higher end of the target range.
Moving down a notch (Level 2), the PCR’s components – the COGS Ratio and the Labor Cost Ratio – they both come in at levels which are slightly above their respective target range.
First observation: running both ratios too close to their thresholds has a “compounding” effect and the PCR quickly goes out of control. Immediate implication: there is a thinner cushion to absorb all other expenses, which are fixed and non-manageable.
From here, a thorough analysis would continue moving deeper: the COGS Ratio would be decomposed in Food Cost Ratio and Beverage Cost Ratio (Level 3) and each of these two metrics would be benchmarked against target ranges or industry standards.
In summary
How would it be to have a simple, clear set of indicators showing the restaurant performance at all times?
The systematic use of KPIs makes the operations’ inner workings immediately exposed. Issues are clearly identified and the operator can proceed with targeted adjustments.
You don’t have to trust us, you can test us
Contact us for a free initial consultation and find out how we can quickly set up a KPI-based control system for your restaurant.