
Restaurant performance: the important metrics
It cannot be stressed enough: a restaurant’s performance must be visible and understood on an ongoing basis. Hence, it needs to be measurable from all angles of the operations.
Before reding any further, it would be of great help to be acquainted with the concept of KPIs and the structure of the income statement. Our Resources section offers a comprehensive summary of both topics.
It is a process
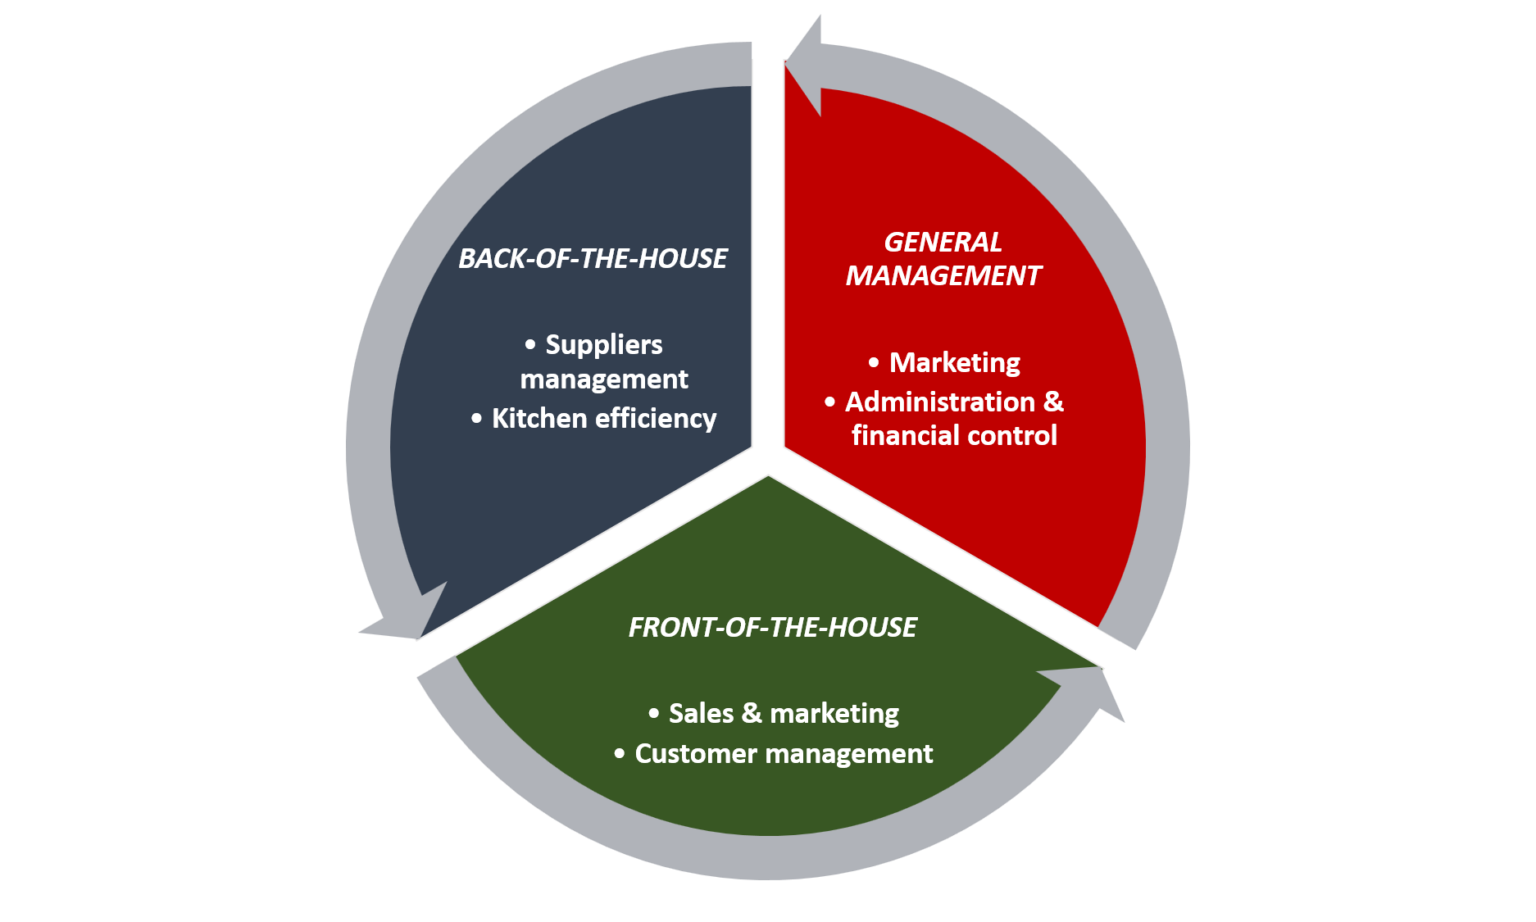
Managing a restaurant is a fairly complicated business because of the number of moving parts involved. As such, a better way to look at performance management and control is looking at it in terms of process flow (Graphic 1).
This allows to break down the operations in single, measurable components which can be directly linked to both: a) actual activities and tasks; b) P&L items.
As it then becomes easier to see how each set of activities contributes to the final result, this methodology also promotes efficiency and accountability within the organization.
More practical that one could think
Let’s dig a little deeper and see how basic activities and tasks have a direct impact on the financial result. The goal is to derive a set of KPIs relevant to any restaurant, regardless of size and other features.
Is this only theory? Not at all. Remember: this is how a restaurant ultimately makes or looses money and having control over this flow is what really makes the difference. Like it or not.
IT’S ALL ABOUT THE PROCESS
From top line to bottom line and back
The net profit is the only number that really matters: it is what flows into the owner’s pockets at the end of it all. How to get there? Well, just make sure that the restaurant is selling enough to cover all the business cost and expenses. And how is this done?
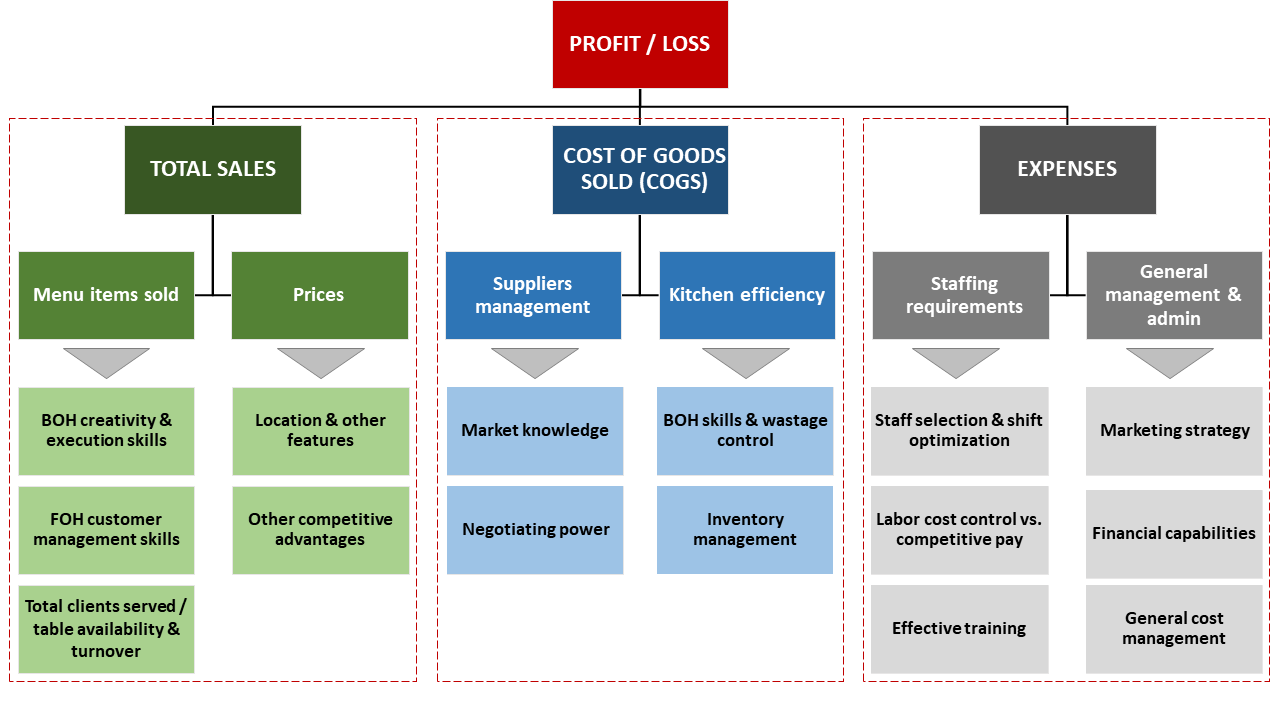
Now, while each owner will surely have their own approach, any restaurant is made up of a set of tasks and activities all of which are more or less necessary and more or less important. Each set directly affects a specific part of the business (and of the P&L): Graphic 2 can offer some guidance.
Example
Let’s look at the Total Sales, for example: the figure just shows how many items have been sold and at what price. It is a very broad and generic information that hides so much in it.
What exactly is driving the sales? Is it mostly the food or the beverages? Is it the quality of the dishes or the fact that the restaurant can apply very rich prices? And why? What dishes are best sellers? Are they priced correctly? Is there any dish in the menu that should not be there?
Moreover, is the serving staff efficient? Is the level of service in line with the restaurant commercial ambitions, as reflected in the customer reviews? How is the staff handling complaints? Are tables being rotated efficiently during the shift?
Let’s stop right there (as this is getting out of control!). It can be as complicated as it one wats to make it but one thing is evident: it would be great if all of these factors could be captured and tracked in an efficient way. Good news: they can be.
BUILDING THE CONTROL PANEL
As mentioned above, in order to be effective the KPI system should be designed to reflect the P&L structure and its performance drivers. Our preferential approach is to divide KPIs in the following categories:
1. General Performance;
2. Total Sales;
3. COGS;
4. Expenses.
This is the high-level structure and we will see how it can be further dissected down to the desired level of granularity (we have also discussed that in one of the previous sections).
A word of caution
Before moving on, though, just beware: in any calculation the output quality depends on the input. Anybody can perform simple arithmetic to calculate KPIs: can they use the relevant numbers though? Can they “clean” the data set to make it relevant? This is what makes the difference.
Another important point: not all restaurants are the same. In the tables below, the “Target range” that indicates a good performance depends on the specific type of restaurant: is it casual, fine-dining, fast-food? The value below are intentionally generic and must be treated accordingly: again, putting numbers together is not necessarily complicated, reading them correctly is another story!
General Performance
| KPI name | Calculation | Target range | Accountabilty |
|---|---|---|---|
| Gross Profit Margin | (Total Sales - COGS) / Total Sales | 70% - 75% | FOH and BOH |
| Net Profit Margin | (Gross Profit - Expenses) / Total Sales | 15% - 25% | General Management |
GROSS PROFIT MARGIN
What is it – It is a measure of the core operations profitability as it indicates how efficiently ingredients (food and beverages) are “transformed” into finished products ready to be sold.
Why it is important – It shows how much is left (after the ingredients) to pay for all the remaining costs. It should be the main driver of the menu pricing strategy.
NET PROFIT MARGIN
What is it – It is a measure of the business overall profitability and financial health.
Why it is important – Basically, it is shows whether the restaurant is a good investment or not from the owner’s perspective. A negative figure, especially if recurring, calls for immediate action and investigation.
Note – Most metrics are generally shown in terms of “margin”, i.e. divided by the Total Sales to account for different business size and other factors. In the case of the Net Profit, though, we would argue that the dollar amount is also relevant: what is the point, for example, for a full-time owner to be involved in its main business that makes $5,000 a year, even though it shows a Net Profit Margin of 30%? The owner’s time could be probably used in a more productive way: time is money, as they say…